⚡ Quick Answer: How does Google make money?
Google makes most of its money by selling ads. When you search, watch a YouTube video, or check your email, Google shows ads next to that content. Businesses pay Google every time someone clicks or views one.
In the second quarter of 2026, advertising brought in $81.63 billion of Alphabet’s $119.8 billion in total revenue. The rest came from Google Cloud ($24.77 billion), subscriptions and hardware ($12.91 billion), and small experimental projects called Other Bets ($0.38 billion). Google is still an advertising company at heart. But Cloud and subscriptions are now its fastest-growing parts.
Key takeaways:
- Advertising made up about 68% of Alphabet’s Q2 2026 revenue — mostly Google Search and YouTube.
- Google Cloud is the fastest-growing segment, up 82% year over year to about $24.8 billion in a single quarter.
- Google doesn’t sell your personal data directly. Advertisers pay for ad placement, not for the data itself.
- Google pays out roughly $16 billion a quarter in Traffic Acquisition Costs to partners like Apple and Samsung before any of that becomes profit.
- Two unresolved U.S. antitrust cases and escalating European penalties could reshape parts of Google’s ad business in the next few years.
Financials: Alphabet Q2 2026 results, reported July 22, 2026.
How Much Does Google Make Per Day, Hour, and Second?
Here’s the scale in plain numbers. In Q2 2026, Alphabet pulled in $119.8 billion in about 90 days. Break that down and it’s easier to feel.
| Time period | Approximate Alphabet revenue (Q1 2026 pace) |
|---|---|
| Per quarter | ~$109.9 billion |
| Per day | ~$1.22 billion |
| Per hour | ~$50.9 million |
| Per minute | ~$848,000 |
| Per second | ~$14,100 |
Expert Tip: These are revenue figures, not profit. After costs, Alphabet kept about 34 cents of operating profit on each revenue dollar last quarter. So the “per second” profit is closer to ~$5,200, not $15,200.
Google’s Business Model in One Minute
Here’s the simple version. You don’t pay Google to use Search, Gmail, or Maps. Advertisers pay Google instead — for the chance to show you an ad while you use those free products.
This works because Google has billions of users. That huge audience is valuable to businesses. So they pay for access to it. Google takes a cut and reinvests part of it to build more free products that pull in even more users.
A few names get mixed up a lot. Let’s untangle them first.
- Alphabet Inc. is the parent company. It owns Google plus a handful of other businesses. When you see a stock price for “Google,” you’re really looking at Alphabet, traded under the tickers GOOGL and GOOG.
- Google Services is Alphabet’s biggest division. It includes Search, YouTube, Maps, Gmail, Android, Chrome, and the Play Store. Nearly all of Alphabet’s ad money comes from here.
- Google Cloud is a separate division. It sells computing power, storage, and AI tools to businesses. It doesn’t touch advertising.
- Other Bets is everything else — long-shot projects like Waymo, the self-driving car company. These stay small and mostly lose money.
Alphabet reports its earnings using exactly this three-way split. Once you know these three names, every number in this article makes sense.
Where Alphabet’s Money Actually Comes From
TL;DR: Advertising is about 68% of revenue, but Cloud is now growing more than five times faster than ads.
Let’s look at the real numbers. This table uses Alphabet’s Q2 2026 results, reported July 22, 2026, next to the same quarter a year earlier.
| Revenue source | Q2 2026 | Growth vs. Q2 2025 |
|---|---|---|
| Search & other advertising | $63.27 billion | +17% |
| YouTube advertising | $11.06 billion | +13% |
| Google Network (AdSense/AdMob) | $7.30 billion | −1% |
| Total Google advertising | $81.63 billion | +14% |
| Subscriptions, platforms & devices | $12.91 billion | +15% |
| Total Google Services | $94.54 billion | +15% |
| Google Cloud | $24.77 billion | +82% |
| Other Bets | $0.38 billion | +2% |
| Total Alphabet revenue | $119.8 billion | +24% |
Source: Alphabet Q2 2026 earnings release (SEC Form 8-K, July 22, 2026). Totals include a small hedging gain not shown as a line above.
Here’s the share of revenue at a glance:
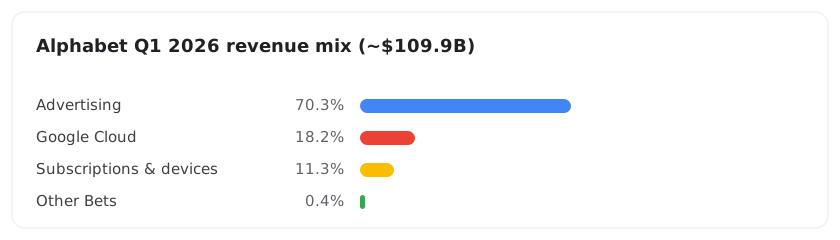
[Alphabet Q2 2026 revenue mix chart showing contributions from Google advertising, Google Cloud, subscriptions, devices, and Other Bets.]
A few things stand out.
Advertising is still the biggest single piece, at about 68% of total revenue. But Google Cloud is now growing more than five times faster than the ad business, and that gap keeps widening.
Notice the one line that barely moved: Google Network, the ads Google places on other companies’ sites and apps through AdSense and AdMob. At $7.30 billion, it was essentially flat year over year. That business has been broadly flat-to-declining for years, as Google’s own properties grow faster than the open web around them.
One more number worth knowing. Alphabet’s operating margin — the share of revenue left as profit after running the business — hit 34% in the quarter, up two points from a year earlier. That’s healthy for a company spending tens of billions on AI infrastructure at the same time, though as you’ll see below, that spending has started to bite in a different place: cash flow.
How Google’s Money Mix Has Shifted Since 2019
The diversification story is easier to see with a before-and-after.
| Revenue share | 2019 (full year) | Q2 2026 |
|---|---|---|
| Advertising | ~83% | ~68% |
| Google Cloud | ~6% | ~21% |
| Subscriptions, platforms & devices | ~11% (bundled differently then) | ~11% |
In 2019, ads were more than four-fifths of the whole company. Cloud was a rounding error. Six years later, ads still lead — but Cloud has more than tripled its share, and subscriptions have become a real business. Google isn’t ad-only anymore. It’s ad-first, with a fast-growing second engine.
2019 figures are approximate and based on Alphabet’s full-year 2019 report; segment definitions have since changed slightly.
Where Google’s Money Comes From Geographically
Most explainers skip this, but Alphabet reports revenue by region — and it answers a real question: which parts of the world fund Google?
In Q2 2026:
- United States — around half of all revenue (about $60.8 billion)
- EMEA (Europe, Middle East, Africa) — the next largest slice, close to 30% (about $32.5 billion)
- Asia-Pacific — mid-teens percent (about $19.3 billion)
- Other Americas — a smaller single-digit share (about $7.0 billion)
The U.S. is by far Google’s biggest single market — and it grew 32% year over year last quarter, faster than any other region. That matters for the antitrust story below: American courts and regulators have leverage over the market that generates the largest chunk of Google’s money.
Exact quarterly geographic splits appear in Alphabet’s 10-Q filing. Shares above are drawn from the Q2 2026 release and stay broadly stable across recent quarters.
How Google’s Ad Auction Actually Works
This is the part most explainers skip. Here’s what happens in the split second between you hitting “search” and an ad appearing.
Step 1: You search for something. Say you type “plumber near me.”
Step 2: Advertisers have already told Google how much they’ll pay for a click on that kind of search. That’s their bid.
Step 3: Google runs an instant auction. But it’s not just about who bids most. Google also scores each ad’s Quality Score — a measure of how relevant and useful the ad is likely to be, based on things like expected click-through rate and landing-page quality.
Step 4: Google multiplies bid by Quality Score to get an Ad Rank. The highest Ad Rank wins the spot — even if a competitor bid more money.
Definition — Ad Rank: Ad Rank = Bid × Quality Score. The highest Ad Rank wins the placement, not the highest bid alone.
Step 5: If nobody clicks, nobody pays. This is the detail almost everyone misses. For most search ads, Google only gets paid when you actually click. If an ad shows and you ignore it, the advertiser owes nothing — and Google makes nothing either.
Worked Example: Two Advertisers, Two Bids
Say Plumber A bids $4.00 per click with a Quality Score of 5. Plumber B bids $3.00 per click but has a Quality Score of 9, because their ad and website match the search much better.
- Plumber A’s Ad Rank: 4.00 × 5 = 20
- Plumber B’s Ad Rank: 3.00 × 9 = 27
Plumber B wins the top spot — despite bidding less — because the ad is more relevant. This is exactly why Google says it won’t show an ad at all when nothing useful is available. A bad ad isn’t worth showing, no matter the bid.
This system is also why many searches show no ads at all. If no advertiser’s Ad Rank clears a minimum bar, Google leaves the results page clean.
Important note on real-world costs: Actual cost-per-click swings wildly by industry. A click can cost a few cents in some niches — or $50 or more in high-value categories like legal services, insurance, and mortgages, where a single new customer is worth thousands. Quality Score is your lever: a better-matched ad can win cheaper clicks than a rival paying more.
Key takeaway: Google’s ad auction rewards relevance, not just budget. A cheaper, better-matched ad can beat an expensive, poorly-matched one — and Google only earns on a click, not an impression.
Search and Google Network: The Core Engine
TL;DR: Search is still Google’s biggest earner, and it kept growing in 2026 even with AI Overviews everywhere.
Google Search is still the single biggest source of Alphabet’s money. In Q2 2026, “Search and other” revenue hit $63.3 billion, up 17% year over year — still an acceleration, not a slowdown, even with AI Overviews now baked into most searches.
That point matters. For two years, the big fear was that AI-generated answers would mean fewer ad clicks. So far, Alphabet’s own numbers tell a different story. The company reported that search queries hit an all-time high again in the quarter, and it told analysts that AI Overviews monetize at a rate similar to traditional search results. CEO Sundar Pichai singled out the FIFA World Cup 2026, which drove record search volume, and noted that more than 1.7 billion unique viewers watched World Cup-related videos on YouTube during the event — a reminder of how much traffic still funnels through Google in the moments people care about.
Google Network is the other half of the advertising picture. It’s how Google helps other websites and apps make money too. Through AdSense (for websites) and AdMob (for mobile apps), Google places ads on millions of third-party pages and shares the revenue with those owners. This is the one ad line that isn’t growing — essentially flat at $7.30 billion in Q2 2026 — as more ad spend shifts to Google’s own properties and other tightly controlled platforms.
YouTube: Ads and Subscriptions
YouTube makes money two separate ways, and they grow at different speeds.
YouTube advertising brought in $11.06 billion in Q2 2026, up 13% year over year. That’s money from ads shown before, during, and alongside videos. Creators get a cut too. Under YouTube’s standard Partner Program split, creators keep 55% of ad revenue on their monetized long-form videos, and YouTube keeps 45%.
YouTube subscriptions — mainly YouTube Premium (ad-free viewing) and YouTube Music — sit inside Alphabet’s “subscriptions, platforms, and devices” bucket, not the ad numbers. Alphabet has said in recent quarters that YouTube subscriptions are now growing faster than YouTube ads — a meaningful shift for a business that used to be almost entirely ad-funded.
Put simply: YouTube is slowly becoming less dependent on ads and more like a subscription streaming service — without giving up its ad business at all.
Google Maps, Gmail, and the “Free” Products
Not every Google product makes money the same way. Some don’t make money directly at all.
How does Google Maps make money?
Google Maps monetizes in three main ways:
- Local ads — businesses pay to appear as a promoted pin or listing when you search nearby.
- Business Profiles — free listings that drive foot traffic, which indirectly supports Google’s local ad business.
- The Maps Platform API — companies like ride-hailing and delivery apps pay Google to build Maps functionality into their own apps.
Alphabet doesn’t break out Maps as its own line. Its revenue folds into the “Search & other” total shown earlier, so there’s no separate public figure for Maps alone.
Does Gmail make money?
Not directly. Gmail, Google Docs, and Google Drive don’t show you ads or charge you for basic use. So why do they exist? They keep you inside Google’s ecosystem, using your Google Account every day. That strengthens the data and engagement that make Google’s ad targeting more accurate elsewhere. They aren’t revenue generators on their own. They’re the glue that holds the rest of the model together.
Google Play Store: The Commission Business
Every time you buy an app, a game, or an in-app subscription on Android, Google takes a cut. This is a completely different model from advertising. It’s a straightforward commission, like a marketplace fee.
This part of Google’s business just changed. Following a global settlement with Epic Games announced March 4, 2026, Google is rolling out a new fee structure — starting June 30, 2026 in the US, UK, and EEA, with the rest of the world phasing in on a staggered schedule through September 2027.
Here’s the breakdown of the new structure, based on the settlement terms:
| Transaction type | Old fee (30% era) | New fee (US/UK/EEA, from June 30, 2026) |
|---|---|---|
| In-app purchases — new installs | 30% (15% for first $1M/yr) | 20% base service fee |
| In-app purchases — developers in Google’s incentive programs | 30% | ~15% (Apps Experience / Play Games Level Up) |
| Subscriptions | 15% flat | 10% flat |
| Using Google Play’s own billing system | Required (built into the rates) | Optional — adds +5% on top of the base rate |
The new model lets developers route payments through their own billing system or link out to an external site entirely. When they do, Google’s 5% billing surcharge doesn’t apply.
Important note: Reporting on the finer rollout details is still settling, and a few outlets describe the tiers slightly differently. Developers should confirm the current, authoritative numbers for their situation on Google Play’s official developer policy pages. (Last verified: July 2026.)
Subscription-based apps — think streaming services or productivity tools — remain one of the fastest-growing categories inside the Play Store, since they generate steady, repeating commission revenue instead of a single one-time purchase.
Google Cloud: From Money-Loser to Growth Engine
Cloud crossed $24 billion in a quarter, growth accelerated to 82%, and enterprise AI is now its single biggest growth driver.
For most of its history, Google Cloud lost money. That changed. In Q2 2026, Cloud revenue hit $24.77 billion, up 82% year over year — a sharp acceleration from the 63% it posted the previous quarter — and its order backlog of signed contracts climbed to roughly $514 billion.
Google Cloud makes money in three distinct ways:
- Infrastructure and compute. Businesses rent Google’s servers, storage, and networking instead of buying their own. It’s straightforward pay-as-you-go pricing. The more computing power a company uses, the more it pays.
- Google Workspace. This is the subscription side — Gmail, Docs, Sheets, and Meet sold to businesses, priced per user per month, similar to how Microsoft sells Office 365.
- Vertex AI and Gemini for enterprise. This is the newest and fastest-growing piece. Companies pay to run AI models on Google’s infrastructure, usually metered by usage. Alphabet said the Cloud acceleration was led by enterprise AI Solutions and AI Infrastructure — and that nearly 90% of the Fortune 100 now use its Gemini Enterprise product.
That third category is doing the heavy lifting. Google’s leadership has said enterprise AI became Cloud’s single biggest growth driver this year, ahead of traditional infrastructure and Workspace.
Subscriptions, Devices, and Hardware
Alphabet groups several smaller businesses into one bucket: “Google subscriptions, platforms, and devices.” In Q2 2026, it brought in $12.91 billion, up 15% year over year.
This category includes:
- Google One — paid cloud storage plans, plus Gemini-powered features
- YouTube Premium and YouTube Music — ad-free subscriptions
- Google Play Store commissions (the non-advertising portion)
- Hardware — Pixel phones, Nest smart-home devices, and more
Alphabet has reported that total paid subscriptions across all its products passed 350 million, with YouTube and Google One as the biggest drivers. That’s a genuinely large number for a company most people still think of as ad-supported. Few consumer tech companies report a paid subscriber base that size.
Traffic Acquisition Costs: What Google Pays to Stay Everywhere
Here’s a piece most explainers leave out. Google doesn’t keep every dollar advertisers pay. It has to pay other companies to stay the default choice on their devices and browsers.
This is Traffic Acquisition Cost, or TAC. Alphabet reports TAC as a specific cost line in its results each quarter. In Q2 2026, TAC came to about $16.2 billion in a single quarter — money that leaves the door before ad revenue becomes profit.
Definition — Traffic Acquisition Cost (TAC): The money Google pays other companies (like Apple and Android device makers) to remain the default search engine on their devices and browsers, plus the revenue share paid to Network partners.
Where does that money go? Mainly to two kinds of partners:
- Distribution partners like Apple, who make Google the default search engine in Safari on iPhones and Macs
- Android device makers like Samsung, who preinstall Google apps and Search on their phones
A federal court found that these payments were central to how Google kept its dominant position in search. The most-cited figure from that case is the roughly $20 billion a year Google paid to Apple alone for default placement. That Apple-specific number is narrower than — and shouldn’t be added to — Alphabet’s total TAC line, which covers all distribution and Network partners combined. We’ll come back to why the search-default payments matter in the regulation section.
The short version: every ad dollar Google earns first has to cover these distribution payments before it becomes real profit. That’s why TAC is one of the most closely watched numbers in Alphabet’s entire report.
Other Bets: Waymo, Verily, and the Long Shots
“Other Bets” is Alphabet’s name for its experimental, long-horizon projects — the ones that might not pay off for another decade, if ever.
The best-known is Waymo, Alphabet’s self-driving car company. It’s making real progress: Waymo has reported more than 500,000 fully autonomous, paid rides per week in 2026, up sharply from a year earlier. Verily (life sciences) and a handful of smaller ventures round out the rest.
Financially, this group is still tiny and unprofitable. Other Bets brought in just $382 million in Q2 2026 — a rounding error next to Alphabet’s $119.8 billion — and lost $1.8 billion in the same quarter.
So why keep funding a division that loses billions? Part of the answer is structural. Alphabet’s founders, Larry Page and Sergey Brin, hold a class of shares with outsized voting power. That gives leadership freedom to fund long-term bets without constant pressure from short-term investors. It’s a deliberate trade-off: accept steady losses now for a shot at owning an entirely new industry later.
How Profitable Is Each Part of Google’s Business?
Revenue is only half the story. What matters for the bottom line is how much of that revenue turns into profit — and it varies enormously by segment.
Google Services is extremely profitable. Its operating margin ran around 42% in Q2 2026, because once the infrastructure for Search and YouTube is built, showing one more ad costs Google very little extra. It remains Alphabet’s profit engine.
Google Cloud used to lose money on every dollar of revenue. That flipped, and the turn is now dramatic. In Q2 2026, Cloud posted operating income of $8.8 billion — an operating margin of about 36%, up from roughly 21% a year earlier. It’s a strong trend, though still early days compared with advertising’s decades of high margins.
Other Bets still loses money on every dollar of revenue, by a wide margin, with no clear timeline for when — or if — that changes.
The takeaway: Alphabet’s overall profitability still leans on the ad business to subsidize everything else — but that’s changing fast. Cloud is closing the gap. That’s exactly why Wall Street watches Cloud’s margin so closely. It’s the clearest signal of how quickly Alphabet’s profit engine is diversifying.
The AI-Era Shift: AI Overviews, Gemini, and the Ad Model
For two years, the biggest question over Google’s business has been simple: what happens to ad revenue when AI answers questions directly, instead of sending people to a page full of results and ads?
Does AI Overviews reduce ad clicks?
Based on Alphabet’s own reported numbers, not yet in any meaningful way. Search revenue grew 17% in Q2 2026, search queries hit an all-time high, and leadership says AI Overviews monetize at a rate similar to traditional search. Ads still appear above, below, and increasingly within AI-generated answers.
How does Gemini actually make money?
Through three channels at once, not one:
- Ads inside AI experiences in Search, similar to traditional search ads
- Subscription upsells through Google One and Gemini’s paid tiers for consumers, plus Gemini Enterprise for businesses (now used by nearly 90% of the Fortune 100)
- API metering through Vertex AI, where businesses pay based on how much AI processing they use. Gemini models now process about 22 billion API tokens per minute, and the Gemini app has 950 million monthly active users.
That’s a fundamentally different — and arguably healthier — mix than the old model, which leaned almost entirely on one type of auction-based ad click.
What about the cost side?
This is what investors worry about most. Alphabet raised its 2026 capital-spending guidance to $195–205 billion, almost entirely to build out AI infrastructure — data centers, chips, and networking — and signaled that 2027 spending will rise again.
The strain is now visible in cash flow. Despite record revenue and a 34% operating margin, Alphabet’s free cash flow turned negative in Q2 2026 — minus $5.9 billion for the quarter — as capital spending ($44.9 billion) outpaced the cash the business generated. To keep funding the buildout, Alphabet raised roughly $50 billion in new equity and preferred stock and took on additional debt during the quarter. The bet is that this spending protects and grows Search, powers Cloud’s AI business, and keeps Gemini competitive. But it means Google’s profit margins — and now its cash cushion — face real pressure from its own spending, even as revenue keeps climbing.
Antitrust and Regulation: The Risk to Google’s Revenue Model
This is the chapter almost no “how Google makes money” article covers — and it’s arguably the most important for understanding where the business is headed. Google’s ad and search dominance is currently the subject of two separate, unresolved U.S. antitrust cases, plus escalating European penalties. (Case status last verified: late July 2026.)
The Ad Tech Case
In April 2025, a federal judge (Leonie Brinkema, Eastern District of Virginia) ruled that Google illegally monopolized two markets: the tools publishers use to sell ad space (its ad server, formerly DoubleClick for Publishers) and the exchange where those ads are auctioned (AdX). The court also found Google illegally forced publishers to use both products together.
The government wants Google to sell off AdX, and possibly its ad server too. Google is arguing for softer, behavioral changes instead — like sharing more bidding data with competitors — without a forced breakup. Closing arguments wrapped in November 2025. As of late July 2026, the judge still hasn’t issued a final remedies decision, though observers expect a ruling this year.
A couple of numbers put the stakes in perspective — but keep them separate rather than combined. Alphabet’s total 2024 revenue was about $350 billion, and Search plus YouTube ads together made up roughly $234 billion of that. Google’s dedicated ad-tech business — the fees it earns for running the exchange and ad server at the center of this case — has been reported at around $30 billion in 2024, a much smaller slice.
Some estimates of “the network ad business at stake” put it near 12% of Alphabet’s revenue, but that describes a broader, different piece than the $30 billion ad-tech fee number. Alphabet doesn’t disclose ad-tech fee income as its own line, so treat any single dollar figure as an approximation — and don’t assume different sources measure the same thing.
The Search Case
In a separate case, a different judge (Amit Mehta) ruled in August 2024 that Google illegally maintained its search monopoly — largely through those Traffic Acquisition Cost payments to Apple, Samsung, and others. His remedy, issued in September 2025, banned Google from signing exclusive default-placement deals and ordered it to share some search data with rivals. Notably, he did not force Google to sell Chrome or Android. Both the government and Google have appealed parts of the ruling, so it’s still working through the courts.
The European Fines
In September 2025, the European Commission fined Google €2.95 billion (about $3.4 billion) for anticompetitive conduct in ad tech, following a formal investigation that began in 2021. The Commission ordered Google to end its self-preferencing and address conflicts of interest across its ad-tech supply chain. Google is appealing.
The pressure escalated in July 2026. On July 23, 2026, the Commission fined Google €890 million (about $1 billion) under the Digital Markets Act for self-preferencing in Search — favoring its own Shopping, Flights, and Hotels results over rivals — and ordered Google to redesign the affected search results within 60 days. With that penalty, Google’s cumulative EU competition and DMA liability now totals roughly €10.4 billion across nearly two decades, including the €4.1 billion Android fine that the EU’s top court made final on July 2, 2026.
What This Could Mean for Revenue
None of this has hit Google’s revenue yet — the Q2 2026 numbers show a business still accelerating. But the risk is real, and unusually for this kind of legal story, it’s been quantified. One Wall Street estimate from early 2026 suggested that if regulators eventually force “choice screens” (making users actively pick a search engine instead of defaulting to Google), Google could lose 5–8% of its search traffic over three years — worth an estimated $15–25 billion in annual ad revenue. A forced sale of the Chrome browser, with an estimated 3.4 billion users worldwide, would be an even bigger disruption, since Chrome is one of Google’s main channels for funneling people into Search by default.
How Google’s Model Compares to Meta, Amazon, and Microsoft
Google isn’t the only tech giant built on advertising. But the mix looks different at each company.
| Company | Main revenue driver | Approx. ad share | Diversification |
|---|---|---|---|
| Alphabet (Google) | Search & YouTube ads | ~68% of revenue | Growing fast via Cloud and subscriptions |
| Meta | Facebook & Instagram ads | ~97–98% of revenue | Minimal — almost entirely ad-dependent |
| Amazon | E-commerce retail | Retail leads revenue; ads and AWS drive fast-growing profit | Highly diversified — retail, cloud, ads, subs |
| Microsoft | Cloud (Azure) & software subscriptions | Small — minimal consumer ads | Highly diversified — cloud, Microsoft 365, Windows, gaming |
The pattern is telling. Google and Meta both lean heavily on advertising, but Meta has almost no other business to fall back on if ad spending slows. Google, Amazon, and Microsoft are all actively building non-advertising revenue as a buffer — and Google’s Cloud growth rate right now is outpacing all of them.
One data point worth watching: eMarketer forecast in April 2026 that Meta would overtake Google in worldwide digital ad revenue for the first time by the end of the year — $243.5 billion versus Google’s $239.5 billion, or 26.8% versus 26.4% of global digital ad spend. Together with Amazon, the three are projected to control 62.3% of all global digital ad spending in 2026.
Even if that overtake happens, it wouldn’t mean Google’s Search business is shrinking. Google’s ad revenue is still forecast to grow — just more slowly (about 12%) than Meta’s accelerating (about 24%) rate. It mainly reflects that Meta depends on ads for nearly all its revenue, while Google is deliberately building Cloud and subscriptions alongside it.
What This Means for Advertisers, Publishers, and Investors
If you’re an advertiser: Understanding Quality Score matters more than obsessing over bid amount. A well-matched, high-quality ad can beat a bigger budget. Watch the antitrust cases too — any forced changes to Google’s ad exchange could shift pricing and competition in ad buying.
If you’re a publisher or creator: Google Network (AdSense) revenue is flat-to-declining industry-wide, which is worth factoring into any strategy that leans on it. YouTube creators, meanwhile, increasingly benefit from subscription revenue (YouTube Premium), not just ad views — a trend likely to continue.
If you’re an investor: Watch four numbers every quarter — Cloud’s revenue growth and operating margin (the clearest sign of diversification), Traffic Acquisition Costs (how much distribution eats into ad profit), capital-expenditure guidance (how aggressively Google is betting on AI infrastructure), and now free cash flow, which turned negative in Q2 2026 as capex outran operating cash.
If you’re an everyday user worried about privacy: Google says it doesn’t sell your personal information directly to advertisers. Instead, it uses your data internally to decide which ads to show you, and advertisers pay for that targeted placement — not for your data itself. You can review and limit this in your Google Account’s ad settings.
Quick action checklist:
- Advertisers: Audit Quality Score before increasing bids
- Publishers/creators: Diversify beyond AdSense given its flat-to-declining trend
- Investors: Track Cloud margin, TAC, capex, and free cash flow each quarter
- Everyday users: Review ad personalization settings in your Google Account
Common Myths About How Google Makes Money
| Myth | Fact |
|---|---|
| “Google sells your personal data to advertisers.” | Google uses your data internally to decide which ads to show. Advertisers pay for placement and targeting — not for your raw data. |
| “Google only makes money from Search.” | Search and YouTube ads are the biggest piece (~68%), but Cloud, Play Store commissions, subscriptions, and hardware make up the rest. |
| “The highest bidder always wins the ad spot.” | Google multiplies bid by Quality Score. A lower bid with a more relevant ad can beat a higher bid with a poor match. |
| “Google keeps 100% of what advertisers pay.” | Google pays out roughly $16 billion a quarter in Traffic Acquisition Costs to partners like Apple and Android makers first. |
| “Free products like Gmail must make money somehow.” | Some don’t, directly. Gmail and Docs exist to keep people in Google’s ecosystem, supporting the ad business elsewhere. |
Quick Reference: How Each Google Product Makes Money
| Product | How it makes money | Reported under |
|---|---|---|
| Google Search | Pay-per-click auction ads | Search & other advertising |
| YouTube | Ads + subscriptions (Premium/Music) | Split across advertising and subscriptions |
| Google Maps | Local ads, Business Profiles, Maps Platform API | Folded into Search & other |
| Gmail, Docs, Drive | No direct monetization — supports the ecosystem | Not separately reported |
| Google Play Store | Commission on app/game purchases (10–20%, tiered) | Subscriptions, platforms & devices |
| Google Cloud | Infrastructure rental, Workspace, Vertex AI/Gemini metering | Google Cloud |
| Pixel, Nest, hardware | Direct device sales | Subscriptions, platforms & devices |
| Waymo | Paid autonomous rides | Other Bets |
FAQs
What is Google’s main source of income?
Advertising. In Q2 2026, ads made up about 68% of Alphabet’s $119.8 billion in quarterly revenue, mostly from Google Search and YouTube.
How does Google make money if it’s free?
You don’t pay to use Google Search, Gmail, or Maps — advertisers do. They pay Google for the chance to show ads to Google’s billions of users, and for most ad types Google only gets paid when someone actually clicks.
How much money does Google make per day?
At its Q2 2026 pace, Alphabet earned roughly $1.32 billion per day, about $54.9 million per hour, and around $15,200 per second in revenue. Profit is lower — roughly a third of that.
How is Google so profitable?
Google’s ad business has very high margins, because showing one more ad costs almost nothing once Search and YouTube’s infrastructure exists. Alphabet’s overall operating margin was 34% in Q2 2026.
How does Google make money from Google Maps?
Through local ads (promoted business listings), paid Business Profile features, and licensing its Maps API to companies like ride-hailing and delivery apps that build Maps into their own products.
Does Google make money from Gmail?
Not directly. Gmail doesn’t show ads or charge most users. It exists mainly to keep people inside the Google ecosystem, which supports the data and engagement that make Google’s advertising elsewhere more effective.
Does AI Overviews hurt Google’s ad revenue?
Not so far, based on Alphabet’s own numbers. Search revenue grew 17% in Q2 2026, queries hit an all-time high, and Google says AI Overviews monetize at roughly the same rate as traditional search.
What if I had invested $1,000 in Google 20 years ago?
Google went public in August 2004 at $85 per share, so $1,000 bought about 11–12 shares. After two stock splits and two decades of growth, that stake would be worth many times the original amount — plausibly in the tens of thousands of dollars, depending on the exact purchase date. This is general market information, not financial advice. For a precise figure, use a brokerage’s historical-return calculator with real prices.
The Bottom Line
Google makes money mainly by selling ads — on Search, YouTube, and millions of partner sites and apps. That hasn’t changed in over twenty years. What has changed is everything around it. Google Cloud is now a genuine growth engine, up 82% last quarter. Subscriptions have quietly become a 350-million-user business. And two major antitrust cases, plus a fresh round of EU fines, could reshape parts of the ad model in the next few years.
For now, the numbers say the core business is doing more than surviving the AI era — Q2 2026 revenue grew 24%. But record AI spending has pushed quarterly free cash flow negative for the first time in years, and that’s the number to watch next. Whether the payoff arrives on Alphabet’s timeline is the real open question.
📖 Continue Reading:
- Companies Owned by Google
- Who Is the CEO of Google?
- Who Founded Google?
- Who Owns Alphabet Inc.?
- Who Owns Google?
Sources & References
- Alphabet Inc. — First Quarter 2026 Results (Investor Relations) and Form 10-Q (SEC EDGAR) , filed April 29, 2026.
- Alphabet Inc. — Q1 2026 Earnings Call Remarks by Sundar Pichai (CEO) and Anat Ashkenazi (CFO).
- CNBC – Alphabet (GOOGL) Q1 2026 Earnings Coverage
- U.S. District Court for the Eastern District of Virginia – United States v. Google LLC (Ad Tech Antitrust Case)
- U.S. District Court for the District of Columbia – United States v. Google LLC (Search Antitrust Case)
- European Commission – Google Ad Tech Antitrust Decision
- Google Play – Epic Games Settlement Announcement and Google Play Developer Policy
- TechCrunch – Google–Epic Settlement and Play Store Fee Changes
- eMarketer – Worldwide Digital Ad Revenue Forecast (April 2026)
- YouTube Help Center – YouTube Partner Program Revenue Sharing
This article reflects publicly reported financial and legal information as of July 28, 2026. Some details are still unfolding — notably the Play Store fee rollout (new rates live in the US/UK/EEA from June 30, 2026, with the rest of the world phasing in through September 2027), the ad-tech antitrust remedies ruling (not yet issued as of publication), and the EU’s €890 million DMA fine (issued July 23, 2026, with a 60-day search-redesign deadline). Figures will change as new quarterly results and court rulings are released.

Olivia Isabel is a Business & Technology Writer specializing in corporate ownership, company leadership, shareholders, acquisitions, and the business strategies behind major global companies. Her work covers technology, artificial intelligence, social media, finance, e-commerce, automotive, and consumer technology, with a particular focus on explaining who owns, controls, and leads well-known companies.
With a background in Economics and Journalism, Olivia approaches each topic as a research-driven business story. She examines company filings, investor-relations materials, regulatory records, official corporate announcements, and reputable financial sources to distinguish between legal ownership, economic ownership, voting control, and day-to-day management.
Her articles explore the founders behind major companies, current CEOs, significant shareholders, parent companies, subsidiaries, acquisitions, and changes in corporate structure. She has written about companies including Google, Alphabet, Apple, Microsoft, Amazon, Meta, OpenAI, Tesla, SpaceX, YouTube, Instagram, TikTok, WhatsApp, Reddit, Spotify, and other major technology and consumer brands.
Olivia’s goal is to make complicated corporate and financial information clear, accurate, and useful for everyday readers. She is particularly interested in corporate strategy, technology business models, entrepreneurship, emerging AI companies, public markets, and the evolution of globally recognized brands.